
The Gini Index (or Gini Impurity) is a widely employed metric for splitting a classification decision tree. In the following sections, you’ll explore its definition, mathematical formula, its role in tree construction, and a step-by-step example demonstrating how it is computed.
What is Gini Index (aka Gini Impurity)?
The Gini Index, also known as Gini Impurity, assists the CART algorithm in identifying the most suitable feature for node splitting during the construction of a decision tree classifier
It derives its name from the Italian mathematician Corrado Gini.
Gini Impurity is a method that measures the impurity of a dataset. The more impure the dataset, the higher is the Gini index.
The term “Impurity” indicates the number of classes present within a subset. The more distinct classes included in a subset, the higher the impurity. This concept is clearly illustrated in the following image.
Visualization
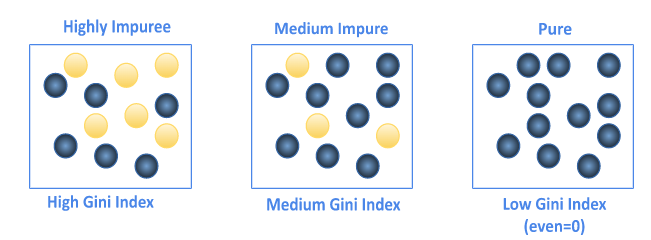
- The leftmost square contains an equal number of yellow and blue balls, indicating an equal probability. It’s diversified, impure. The Gini index will be high.
- The second squarecontains a greater number of blue balls compared to yellow ones. It’s still diversified, but more pure than the first square. The Gini index will be medium.
- The last square, there are only blue balls, it’s pure. The Gini index is equal to 0
In the following paragraph, you can use the provided mathematical formula, , to calculate the value of the Gini Index, as demonstrated in the preceding illustration.
Mathematical Formula
The computation of the Gini index is as follows:
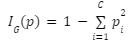
Where:
- C: The number of classes included in the subset
- i: The class i, with i {1, 2, 3, ….C}
- pi : The proportion of the class “i” is in the subset.
To remember, the lowest the value of the Gini Index, the more pure is the dataset, and the lower is the entropy.
In the forthcoming sections, we will apply the Gini Index formula to split and construct a tree through practical exercises.
How is the Gini Index used in the Decision Trees model?
Gini index helps building a classification tree by following those steps:
- For each node:
- For each feature in the dataset, and each threshold we compute the weighted average value of the Gini index
- The best feature to use to split the current node is the one having the lowest Gini Index
- Repeat these steps for each subtree
- Stop splitting the tree when stop criteria is met
Practical example
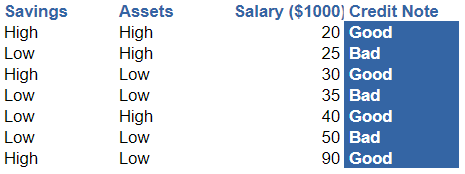
Let’s take our favorite dataset as in the entropy article to compute the Gini Index and understand how to use it.
General Gini Index
The Gini Index for this dataset is 0.49:

There are 4 Good credit notes and 3 Bad ones:

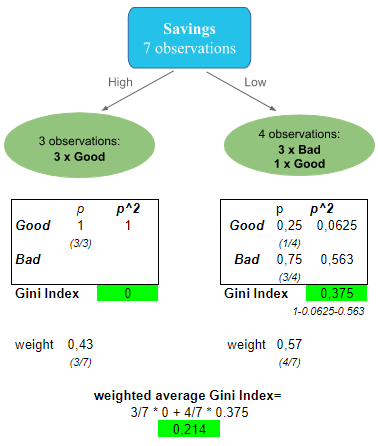
Feature 1 – Categorical: Savings
Let’s use the first feature Savings to compute the Gini Index
- On the left side, there are 3 observations, all are Good. This is a pure subset. Thus the Gini Index is equal to 0.
- On the right dataset, there are more heterogeneous data: 3 Bad and 1 Good. This gives a Gini index of about 0.375
- The weighted average Gini Index of this subtree is 0.214.
Feature 2 – Categorical: Assets
Now, let’s do the same exercise for Assets:
- There are more mixed classes on both sides: Left side has 0.44, and the right side has an even higher value 0.5, as we have equality on the probabilities.
- The weighted average Gini Impurity is 0.476
- This value is much higher than the Savings substree value. Thus, this feature will not be kept as a feature to split the node tree.

Feature 3 – Continuous: Salary
Let’s do it for Salary feature:
- The first average value to test for splitting is $22.5K. We get a Gini Index of about: 0.429. Which is still bigger than the one from Savings.

- For the average salary $27.5K, the Gini index is also high: 0.486

Now that you have a clear idea of how we compute the Gini index, you can do it for the other features and values to choose the good candidate for the root node, and then do the same for the other nodes in the tree.
Summary
Important thing to remember: The lowest is the value of the Gini Index, the better is the feature selected to split the node. Thus leading to more pure subsets for the branches.
In this article, you have learned about Gini Index metric, used in decision trees classification:
- Its definition
- Its mathematical formula and the intuition behind
- How to use it to build a tree: Its computation, step by step, feature by feature using an example of a dataset
I hope you enjoyed reading this article.
Did you learn some useful information in this article? Tell me in the comments, I appreciate your feedback 👇.