In this article, you will learn Momentum Algorithms Using Python from scratch. Along the way, you will gain insights into the distinctions between momentum algorithms and trend following algorithms, as well as the various types of momentum algorithms. Specifically, we will focus on implementing the following momentum algorithms using Python:
- Price Rate of Change (ROC)
- Absolute Momentum
- Dual Momentum
- Relative Momentum
What is a Momentum Algorithm?
The momentum algorithms are algorithmic trading strategies that use technical indicators like moving averages or relative strength index to identify stocks having positive or negative momentum. The stocks that demonstrate a good momentum in the recent past are likely to perform well in the near future.
The strategy generates buy and sell trading signals based on these indicators. If the indicators show a good momentum, a buy order is triggered, meaning that the stock price will continue to rise. If the indicator shows a negative momentum a sell order is triggered, meaning that the stock price will continue to fall.
Remember, past performance is not necessarily indicative of future performance, and that the results of backtesting a strategy on historical data may not always be reflective of real-world performance. One needs to look for other information like fundamental data, recent news about the company to check the signal he is willing to use. Also, one needs to monitor closely market conditions to be able to intervene to avoid losses.
What is the difference between Momentum Algorithms and Trend Following Algorithms?
There are some similarities, but also some differences.
For example MACD (Moving Average Convergence Divergence) is a trend following and momentum technical indicator.
Momentum algorithm is a type of trend following algorithm but used in a short-term period.
Momentum algorithm seeks to determine if a stock has had a good momentum in the recent past, if yes it is likely to continue to have a good performance in the near future.
Trend Following algorithm seeks for a long-period trend to follow, and profits from the direction these trends are taking.
What are the different types of Momentum algorithms?
There are different types of momentum algorithms. In the following, I will talk about:
- Price Rate of Change (ROC)
- Absolute Momentum
- Relative Momentum
- Dual Momentum
In the following, you will learn these momentum algorithms using Python, by first describing each algorithm, its formula and then giving an example of its implementation in Python from scratch.
Price Rate of Change (ROC) algorithm:
Definition
ROC is a type of momentum trading algorithm that calculates the percentage change in price over a given period of time. When the ROC of a given stock is positive, it means that the stock has positive momentum. A buy signal trading is triggered, as the indicator expects this positive price momentum to continue.
ROC = 100*(P1/Pn-1)
With:
- P1: Actual Closing Price
- Pn: Closing Price n-days ago
Python Code
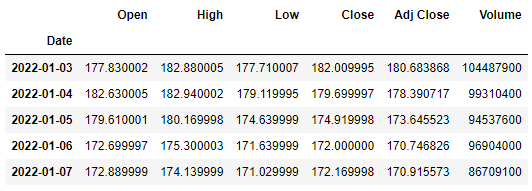
I will be using this dataframe containing Apple historical stock prices. At the end of the article you will find how I downloaded this data using Python.
Implementation:
- n = 10-day period of time.
- ROC value is calculated, it corresponds to the return over 10-days.
- If the ROC of one day becomes positive, a buy signal is triggered
- If the ROC of one day becomes negative, a sell signal is triggered
- A return and cumulative returns are calculated to assess the performance of strategy
# Define the time period for calculating the ROC
n = 10

# Calculate the ROC indicator
df['ROC'] = df['Adj Close'].pct_change(periods=n)

# Generate buy signals when the ROC becomes above its signal line (0)
df['Buy'] = (df['ROC'] > 0) & (df['ROC'].shift(1) < 0)

# Generate sell signals when the ROC becomes below its signal line (0)
df['Sell'] = (df['ROC'] < 0) & (df['ROC'].shift(1) > 0)

# Buy securities when a buy signal is generated and sell them when a sell signal is generated
# 1 for Buy, -1 for Sell, 0 for Hold
df['Signal'] = np.where(df['Buy']==True, 1, np.where(df['Sell']==True,-1,0))

# Calculate the daily returns of the strategy
df['Returns'] = df['Signal'].shift(1) * df['Adj Close'].pct_change()
df['Returns+1'] = 1 + df['Returns']

# Calculate the cumulative returns of the strategy
df['Cumulative_Returns'] = (1+df['Returns']).cumprod()

# Print the final cumulative return
print('Final Cumulative Return Over The Whole Period: ', df['Cumulative_Returns'][-1]-1)   Final Cumulative Return Over The Whole Period:  0.04052975893266497
Plotting the cumulative return and the signal:
df[['Returns+1','Cumulative_Returns']].plot(figsize=(8,4))
plt.title("Price Rate of Change (ROC)")
plt.show()

df[['Signal']].plot(figsize=(8,4))
plt.show()
The cumulative return was not that good in the period starting from mid-august 2022 until mid-december 2022.
You can try modifying the time period in days, to find the best interval to use. Try 15 days and 5 days. You will see that 5 days gives a higher return.
Absolute Momentum
Definition
Absolute Momentum buys securities that have positive returns over a certain time period and sells those with negative returns. It’s also known as time-series momentum.
Python Code
Implementation:
- I calculate the return of the stock
- I calculate a trading signal
- I calculate a moving average of this signal
- Then I calculate the final signal to use: 1 for buy, -1 for sell and 0 for hold.
def absolute_momentum(df, window):
    """
    Calculate the daily return
    Calculate a signal: if return is positive, then 1, if negative -1, else 0
    Calculate a moving average over "window" period to smooth the signal
    Calulate the final signal:
        if the smoothed signal is positive then a buy (1) order signal is triggered,
        when negative a sell order is trigerred (-1),
        else stay in a hold position (0)
    """
    df['returns'] = df['Adj Close'].pct_change()
    df['signals']=np.where(df['returns']>0,1,np.where(df['returns']<0,-1,0))
    df['signals_ma']=df['signals'].rolling(window).mean()
    df['signals_final']=np.where(df['signals_ma']>0,1,np.where(df['signals_ma']<0,-1,0))
    return df

#Calculate the signals
df = absolute_momentum(df, 30)

df[['returns']].plot(figsize=(8,4))
plt.title("Returns")
plt.show()

df[['signals_ma','signals_final']].plot(figsize=(8,4))
plt.legend(loc = 'upper left')
plt.title("Absolute Momentum")
plt.show()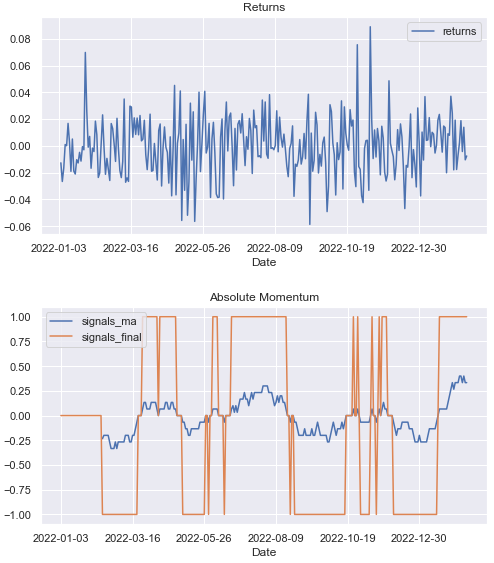
In the second graph, the blue line shows the smoothed signal. When it’s positive, a buy signal is triggered (1), when it’s negative a sell order is triggered.
Relative Momentum:
Definition
Relative momentum is a type of algorithmic trading that calculates how well a stock price is performing against the whole market or a specific benchmark. It’s used to identify the stocks that are outperforming or underperforming the market or the given benchmark.
It can also be used to calculate the strength of the stock against itself over a certain time of period. It helps determine if the stock was overbought or oversold during a certain time period by using the RSI index.
Python Code
Here I will be comparing Apple to the market which is represented by the index SP500:
- Calculate the moving average return over 14 days for the stock and the index
- Calculate the relative strength ratio by dividing stock over index rolling mean return
- Calculate the relative strength line which is the rolling mean of the relative strength ratio
- Calculate the trading signal to buy or to sell if the ratio is above or below the signal line
window = 14
benchmark_ticker = 'SPY'
benchmark_data = download_stock_data(benchmark_ticker,timestamp_start,timestamp_end).set_index('Date')
stock_returns = df['Adj Close'].pct_change()
benchmark_returns = benchmark_data['Adj Close'].pct_change()
# Calculate rolling mean of the return over 14 days for the stock and the index
stock_rolling_mean = stock_returns.rolling(window=window).mean()
benchmark_rolling_mean = benchmark_returns.rolling(window=window).mean()
# Calculate relative strength
relative_strength = stock_rolling_mean / benchmark_rolling_mean
# Calculate rolling mean of relative strength
relative_strength_rolling_mean = relative_strength.rolling(window=window).mean()
# Create signal based on relative strength rolling mean
signal = np.where(relative_strength > relative_strength_rolling_mean, 1, -1)
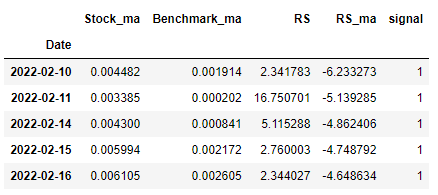
df_rel=pd.concat((stock_rolling_mean,benchmark_rolling_mean,relative_strength,relative_strength_rolling_mean),axis=1)
df_rel.columns=['Stock_ma','Benchmark_ma','RS','RS_ma']
df_rel['signal']=signal
df_rel=df_temp.dropna()
df_rel.head()download_stock_data* will be explained in “Loading Dataset” part.
Here is when plotting the whole period:
df_rel[['RS','RS_ma']].plot(figsize=(6,4))
plt.title('Relative Momentum')

df_rel[['signal']].plot(figsize=(6,4))
plt.title('Signal')
plt.show()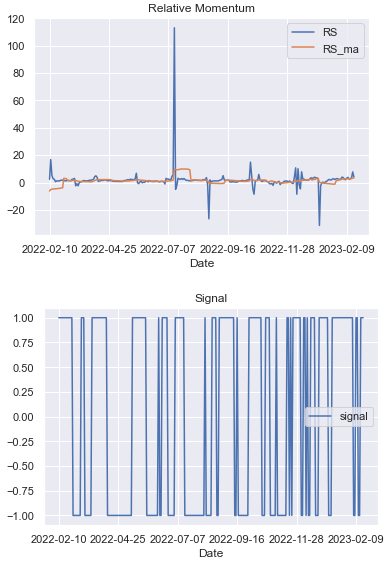
Let’s plot the ratio and the relative strength line for a certain period (to see more clearly):
df_rel.query("Date>'2022-08-30' and Date<'2022-11-30'") [['RS','RS_ma','signal']].plot(figsize=(8,8))
Dual Momentum
Definition
Dual Momentum is an algorithm that combines two indicators: The relative strength and the absolute momentum. It is based on the idea that when a stock is performing well relative to its peers and at the same time, its absolute momentum is positive, it is likely to continue to perform well in the near future.
Python Code
In this example, I build 2 datasets:
- df_global: in which we have 4 stocks (‘NFLX’, ‘AMZN’, ‘GOOG’, ‘AAPL’) that make up our portfolio. The goal is to know which one has a strong dual momentum.
- df_global_market: which represents the market or a specific benchmark. For illustration, I put only 6 stocks : ‘MSFT’, ‘META’, ‘GM’, ‘GS’, ‘TTE’, ‘F’.

Then:
- The momentum for each stock in the portfolio is computed
- The momentum for the whole market is computed
- Then, the dual momentum is computed for each stock in the portfolio
- Also a rank among the 4 stocks is given for the whole period
def dual_momentum(df_global,df_global_market,window):
"""
dual_momentum:
Calculate the momentum for each stock
Calculate the momentum of the market
Calculate the dual momentum as the product of the stock's momentum and the market one
"""
# Calculate 10-days momentum of the prices
mom = df_global.pct_change(window).dropna()
# Calculate 10-days momentum of the global stock market
global_mom = df_global_market.pct_change(window).dropna()
global_mom_mean = global_mom.mean(axis=1)
# Create a data frame to hold the final results
results = pd.DataFrame()
for ticker in df_global.columns:
mom_ticker = mom[ticker]
# Calculate the dual momentum score for this stock
dual_mom = pd.DataFrame(mom_ticker * global_mom_mean)
dual_mom.columns=[ticker+'_dual_mom']
results=pd.concat((dual_mom,results),axis=1)
return results
window=10
results=dual_momentum(df_global,df_global_market,window)
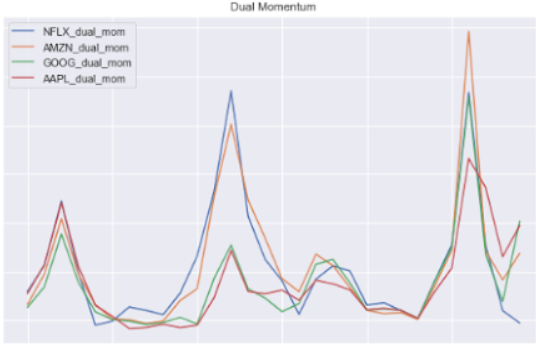
results.iloc[-30:,:].plot(figsize=(12,6))
plt.title("Dual Momentum")
plt.show()
results.apply(lambda x: x.rank(ascending=False),axis=1).iloc[-30:,:].plot(figsize=(12,6))
plt.title("Rank of Dual Momentum (1:Best, 4:Worst)")
plt.show()I only plotted the last 30 days for clarity in the chart:
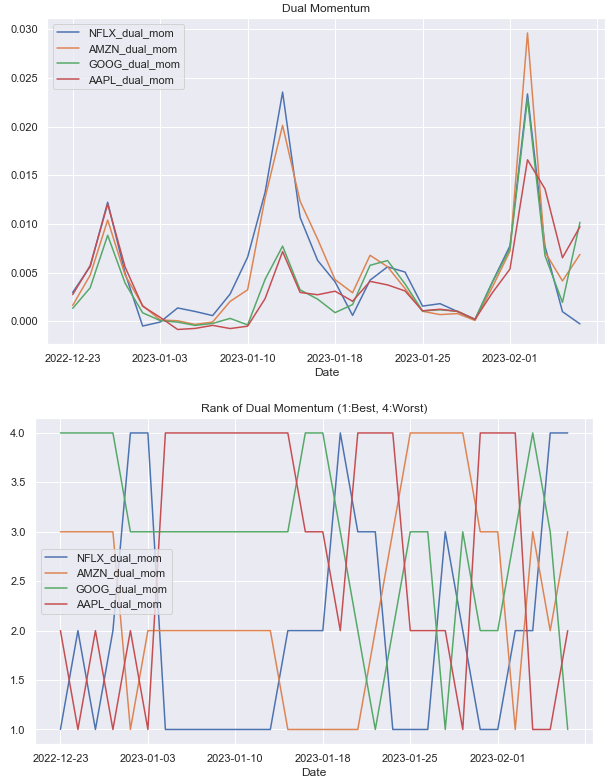
In the last period, Google is ranked N°1 against the other stocks, because it’s showing a strong dual momentum. The following one in the ranking is Apple. The last one is Netflix.
This ranking, as you can see in the graph, was not constant over the past 30 days. Apple was often ranked 4. On the other hand, we can see Netflix taking the first place on the podium more often than the other stocks.
Loading Dataset
There are different solutions to download datasets. Here are two methods you can use:
First method
import pandas_datareader.data as web
import yfinance as yfin

start = dt.datetime(2022, 1, 1)
end = dt.datetime.today()

yfin.pdr_override()

# Define the ticker symbol for the stock
ticker = 'AAPL'

# Load the stock prices from Yahoo Finance
df = web.DataReader(ticker, start, end)

df.tail()
I find it slower than the second method, which I used for the whole datasets.
Second method
AAPL
def download_stock_data(ticker,timestamp_start,timestamp_end):
    url=f"https://query1.finance.yahoo.com/v7/finance/download/{ticker}?period1={timestamp_start}&period2={timestamp_end}&interval
=1d&events=history&includeAdjustedClose=true"
    df = pd.read_csv(url)
    return df

datetime_start=dt.datetime(2022, 1, 1, 7, 35, 51)
datetime_end=dt.datetime.today()

# Convert to timestamp:
timestamp_start=int(datetime_start.timestamp())
timestamp_end=int(datetime_end.timestamp())

df = download_stock_data("AAPL",timestamp_start,timestamp_end)
df = df.set_index('Date')
SPY
benchmark_ticker = 'SPY'
benchmark_data = download_stock_data(benchmark_ticker,timestamp_start,timestamp_end).set_index('Date')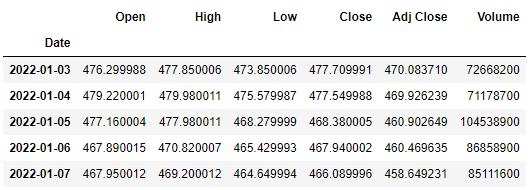
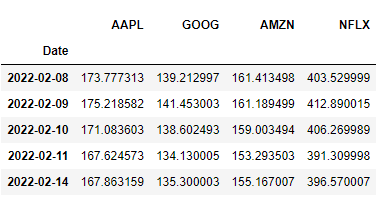
df_global with 4 stocks:
tickers=['AAPL','GOOG','AMZN','NFLX']

df_global=pd.DataFrame()
for ticker in tickers:
    df = download_stock_data(ticker,timestamp_start,timestamp_end)[['Date','Adj Close']]
    df = df.set_index('Date')
    df.columns=[ticker]
    df_global=pd.concat((df_global, df),axis=1)
df_global.head()
df_global_market with 6 stocks
tickers=['MSFT','META','GM','GS','TTE','F']

df_global_market=pd.DataFrame()
for ticker in tickers:
    df = download_stock_data(ticker,timestamp_start,timestamp_end)[['Date','Adj Close']]
    df = df.set_index('Date')
    df.columns=[ticker]
    df_global_market=pd.concat((df_global_market, df),axis=1)
df_global_market.head()
Summary
In this article, you have learned:
- Momentum Algorithms definition
- Different types of Momentum Algorithms
- In-Depth implementation of 4 of them using Python:
- Price Rate of Change (ROC)
- Absolute Momentum
- Relative Momentum
- Dual Momentum
I hope you enjoyed reading me.
Leave me a comment to tell me how you find the content of this article.
Also, if you want to learn something specific, tell me about it, it could be an idea for a future article.