
In this article you will learn how to use ChatGPT to learn Algorithmic Trading:
- What is Algorithmic Trading?
- What type of investors are using Algorithmic Trading?
- What are the different types of Algorithmic Trading?
- Learn in details, with Python, some Trend Following algorithms:
- Moving Average Crossover
- Channel Breakout
- Moving Average Convergence Divergence (MACD)
ChatGPT and Algo Trading
As you may know now, ChatGPT is a language generation model developed by OpenAI. you can ask it anything you want. So why not learn algorithmic trading with ChatGPT?
At the beginning, I wanted to just play with it and see what answers I would get. I didn’t believe in it, but I can admit I was really impressed.
So let me show you how you could use it to learn different types of algorithmic trading (By practicing using Python code examples).
But before that, here are some warnings:
- There is no recommendation of the best algorithm to use
- This is in no way an encouragement to invest in financial markets.
- Take into account the warning raised by ChatGPT on many code python examples it gives:

Keep in mind:
- In some cases, you will have broader answers, but it’s still a very good starting point to learn a lot of things in this area.
- Some of the signals calculated by these algorithms could be used as features in machine learning models.
- All the practical examples in Python, in this tutorial, use Close prices. You can perform the same calculation using Intraday prices (bin =10 secs, 1min, 5min…)
- Regenerate the answers, so you can get another complementary point of view or another implementation of Python code.
How will we use ChatGPT?
- Ask for a definition
- Ask for a mathematical formula or a Python code example
- Asking for a Python code example is really important to understand the algorithm. I find it even more useful than a simple definition or formula
- Ask for public ressources datasets to practice with
- Practice and see the results
You need sometimes, in order to have more precise answers:
- Ask the same question differently, by modifying the wording. For example: Strategy instead of Algorithm
- Regenerate answers to get different implementation examples in Python.
- If you tell you do not agree with the answer, it will apologize and please you, but be careful you need to check with another source.
Even with those caveats, you’ll find this to be a very powerful tool that you can use to learn a ton of stuff. Let’s start!!
What is Algorithmic Trading?

Type of Investors using algorithmic trading?
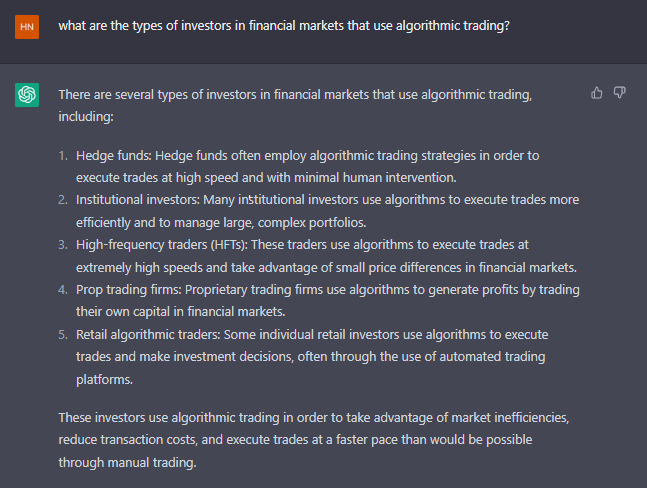
Using this answer, you can dig into more details. For example asking what types of trading used by each type of investors: Hedge Funds, Institutional investors…
Now, we need to have a general idea of the different types of algorithmic Trading.
What are the different types of algorithmic trading?
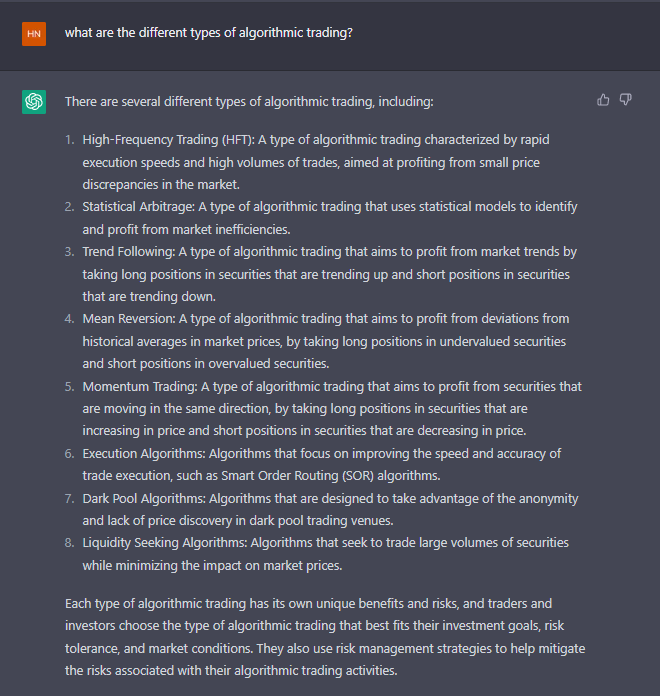
This is a very broad answer. Some of the algorithms are very sophisticated, and some of them are more simple.
For example, in Dark pools, some participants in the market are aiming to post their orders there because they are seeking to trade very large orders. They do not want to be discovered by the market to not impact the prices. In the dark pools, the order books are hidden, contrary to the primary or the secondary markets. So it’s not really a sophisticated algorithm which is trying to find some signal, it’s just a simple one seeking for liquidity.
You can ask for each of these categories: Definition, different types of algorithms, type of investors using these algorithms…
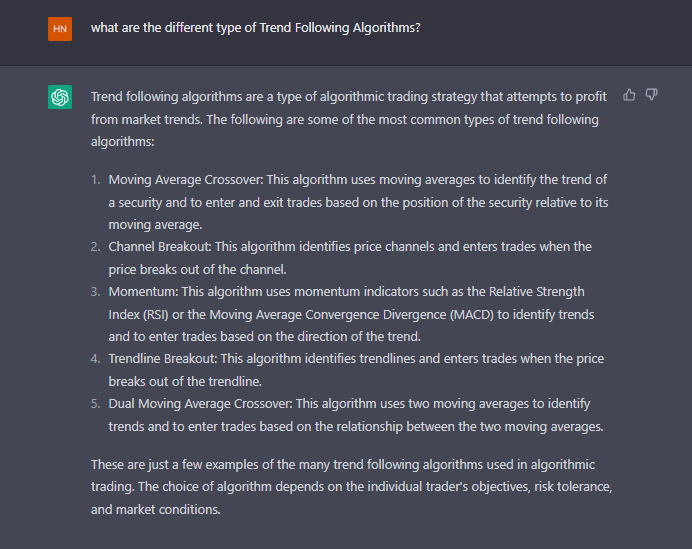
Here is an example of how to proceed, let’s be more specific: Let’s learn about Trend Following algorithms.
What are the different types of Trend Following Algorithms?
Trend Following Algorithms
In the following, we will practice with Python:
- Moving Average Crossover
- Channel Breakout
- MACD: Moving Average Convergence Divergence
Load dataset
Before digging in details in each algorithm, let’s first find a stock price dataset to use in Python:

I didn’t use exactly this code, because the link wasn’t working for me. But I was inspired by this answer to find the right solution.
Apple stock prices:
import pandas as pd
import datetime as dt

def download_stock_data(ticker,timestamp_start,timestamp_end):
    url=f"https://query1.finance.yahoo.com/v7/finance/download/{ticker}?period1={timestamp_start}&period2={timestamp_end}&interval
=1d&events=history&includeAdjustedClose=true"
    df = pd.read_csv(url)
    return df

datetime_start=dt.datetime(2022, 2, 8, 7, 35, 51)
datetime_end=dt.datetime(2023, 2, 8, 7, 35, 51)

# Convert to timestamp:
timestamp_start=int(datetime_start.timestamp())
timestamp_end=int(datetime_end.timestamp())

df = download_stock_data("AAPL",timestamp_start,timestamp_end)
df = df.set_index('Date')
df.head()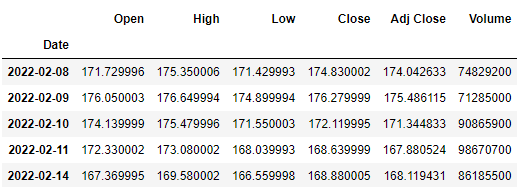
Moving Average Crossover algorithm
Python Code
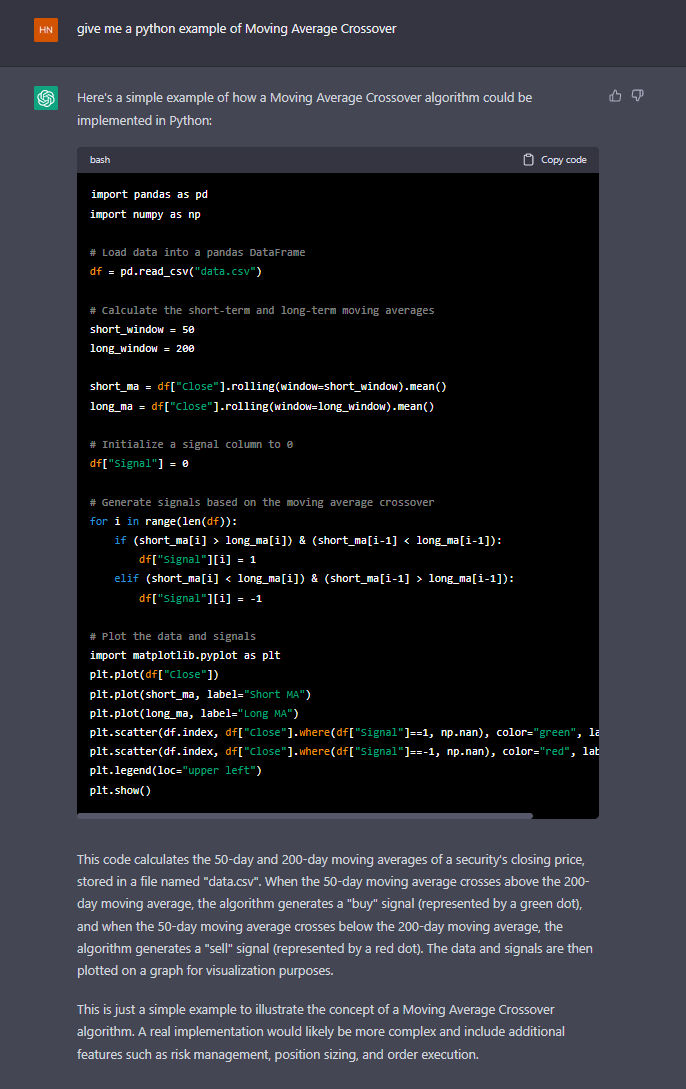
I asked for a Python code example. ChatGPT also gives an explanation of the code it generates. You can copy the code and use it (Sometimes there are some errors):
Let’s practice
I slightly modified the code to get the information I need: I modified the short and long window of the moving average:
import pandas as pd
import numpy as np

# Load data into a pandas DataFrame
# df = pd.read_csv("data.csv")

# Calculate the short-term and long-term moving averages
short_window = 25
long_window = 50

short_ma = df["Close"].rolling(window=short_window).mean()
long_ma = df["Close"].rolling(window=long_window).mean()

# Initialize a signal column to 0
df["Signal"] = 0

# Generate signals based on the moving average crossover
for i in range(len(df)):
    if (short_ma[i] > long_ma[i]) & (short_ma[i-1] < long_ma[i-1]):
        df["Signal"][i] = 1
    elif (short_ma[i] < long_ma[i]) & (short_ma[i-1] > long_ma[i-1]):
        df["Signal"][i] = -1

# Plot the data and signals
import matplotlib.pyplot as plt
df["Close"].plot(figsize=(15,5))
plt.plot(short_ma, label="Short MA")
plt.plot(long_ma, label="Long MA")
plt.scatter(df.index, df["Close"].where(df["Signal"]==1, np.nan), color="green", label="Buy")
plt.scatter(df.index, df["Close"].where(df["Signal"]==-1, np.nan), color="red", label="Sell")
plt.legend(loc="upper right")
plt.show()
The red and green points give the signals on when to buy or sell the sock.
This is a simple implementation example of the algorithm.
You can modify the parameters to fit the study you are working on.
Channel Breakout
Python Code

Notice that as I asked for a dataset, it gives me Apple stock prices. ChatGPT suggests it directly in the Channel Breakout Python code.
Let’s practice
I modified the code (some mistakes on it).
It calculates the upper and lower band of the moving average of the stock. When the prices cross the upper band we sell, and we buy if the prices cross the lower band.
I plot only the latest buy and sell order signals.
import pandas as pd
import matplotlib.pyplot as plt

def channel_breakout(df, window=20, n_std=2):
    rolling_mean = df['Close'].rolling(window=window).mean()
    rolling_std = df['Close'].rolling(window=window).std()
    upper_band = rolling_mean + (rolling_std * n_std)
    lower_band = rolling_mean - (rolling_std * n_std)

    buy_signal = None
    sell_signal = None
    hold_signal=None
    for i in range(window, len(df)):
        if df.iloc[i]['Close'] > upper_band[i]:
            sell_signal = i
        elif df.iloc[i]['Close'] < lower_band[i]:
            buy_signal = i
        else:
            hold_signal=i
    return buy_signal, sell_signal,hold_signal, rolling_mean, upper_band, lower_band

buy_signal, sell_signal,hold_signal, rolling_mean, upper_band, lower_band = channel_breakout(df)
x=df.index.values
plt.figure(figsize=(15,5))
df['Close'].plot()
plt.plot(rolling_mean, label='Rolling Mean', color='red')
plt.plot(upper_band, label='Upper Band', color='green')
plt.plot(lower_band, label='Lower Band', color='yellow')
plt.axvline(x=buy_signal, color='blue', linestyle='--', label='Buy Signal')
plt.axvline(x=sell_signal, color='black', linestyle='--', label='Sell Signal')
plt.legend()
plt.show()
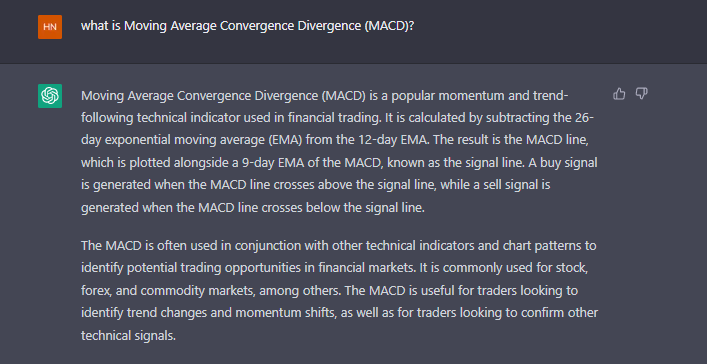
Moving Average Convergence Divergence (MACD)
I asked for a definition and a formula:
Formula

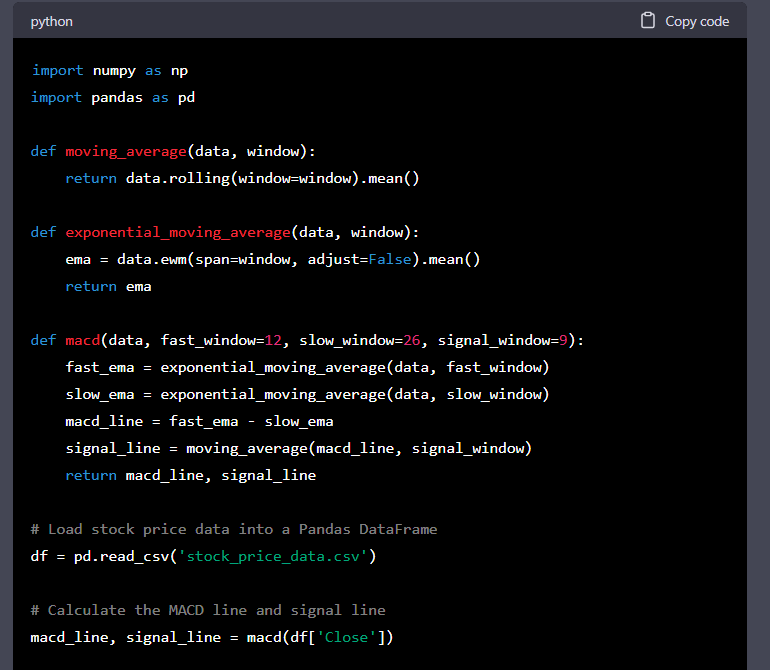
Python Code example:
ChatGPT gives an example of the implementation of MACD in Python.
But there is an incorrect answer if we follow exactly the definition it gives:
- Signal Line is an EMA and not a simple moving average as written in the code. You need to be careful.
But still, this is an example of implementation, you can customize the formulas and find the best computation fitting your situation.
I asked for the mistake:

Then, I asked to have the correct Python code:

Let’s practice
I adapted a little bit of the code to my example.
We calculate MACD and Signal lines:
- When the MACD line crosses above the signal line, it triggered a buy signal
- When the MACD line crosses below the signal line, it triggered a sell signal
import numpy as np
import pandas as pd
import matplotlib.pyplot as plt

def calc_macd(prices, fast_window, slow_window, signal_window):
    fast_ewma = prices.ewm(span=fast_window, adjust=False).mean()
    slow_ewma = prices.ewm(span=slow_window, adjust=False).mean()
    macd = fast_ewma - slow_ewma
    signal = macd.ewm(span=signal_window, adjust=False).mean()
    return macd, signal

macd, signal = calc_macd(df['Close'], 12, 26, 9)
df['MACD_line']=macd
df['Signal_line']=signal
df = df.set_index('Date')

df[['Close']].plot(label='Prices',figsize=(10,6))
plt.plot(macd, label='MACD Line', linestyle='--')
plt.plot(signal, label='Signal Line', linestyle=':')
plt.legend() plt.title("MACD")
plt.show()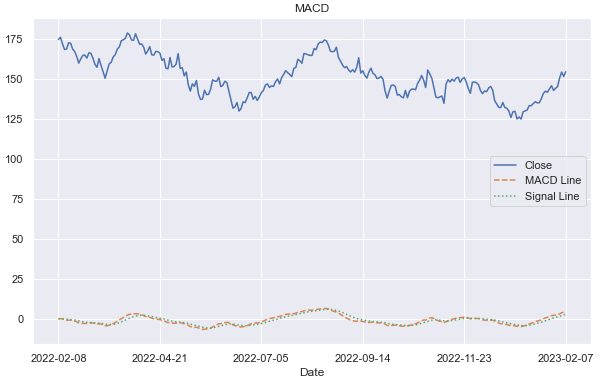
Let’s focus on MACD and Signal Line starting 23 November 2022:
df.query("Date>='2022-11-23'")[['MACD_line','Signal_line']].plot(figsize=(10,6))
plt.legend()
plt.show()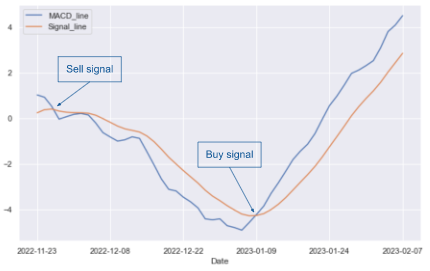
Summary
In this article, you have learned:
- How to use ChatGPT to learn about Algorithmic Trading
- The most important concepts in this area
- Some of Trend following algorithms in details
- Practice in Python by implementing 3 Trend Following algorithms